

| User guide | |

(The code for this example can be found here: [ view | edit | run ] )
When using layouts to position axes that can also have a
colorbar or legend it is very important to group the axes
with its colorbar and legend by putting them inside a uicontainer.
The following example illustrates this.
Open a new figure window and remove the toolbar and menus.
window = figure( 'Name', 'Axes legend and colorbars', ...
            'MenuBar', 'none', ...
            'Toolbar', 'none', ...
            'NumberTitle', 'off' );
The layout involves two axes side by side. Each axes is placed into a uicontainer so that the legend and colorbar are "grouped" with the axes.
hbox =uix.HBoxFlex('Parent', window, 'Spacing', 3); axes1 =axes( 'Parent',uicontainer('Parent', hbox) ); axes2 =axes( 'Parent',uicontainer('Parent', hbox) );
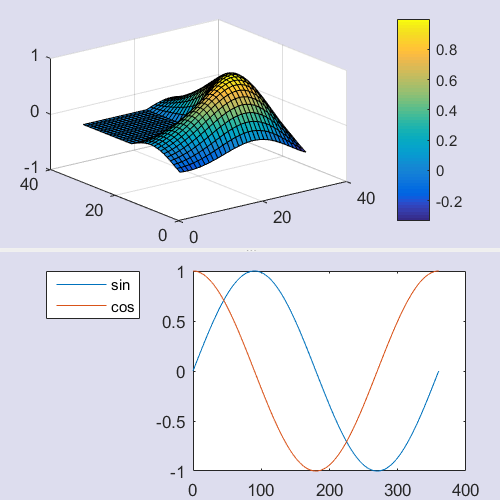
Give the first axes a colorbar and the second axes a legend.
surf( axes1,membrane( 1, 15 ) );colorbar( axes1 );
theta = 0:360;plot( axes2, theta,sind(theta), theta,cosd(theta) );legend( axes2, 'sin', 'cos', 'Location', 'NorthWestOutside' );
 |
Axes inside layouts | [Top] | Controlling visibility |  |